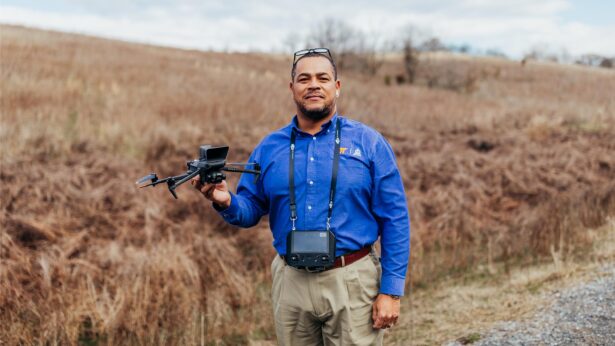
By David Brill
Plan to watch the Super Bowl? UT professor Yilu Liu will watch how much electricity you use.
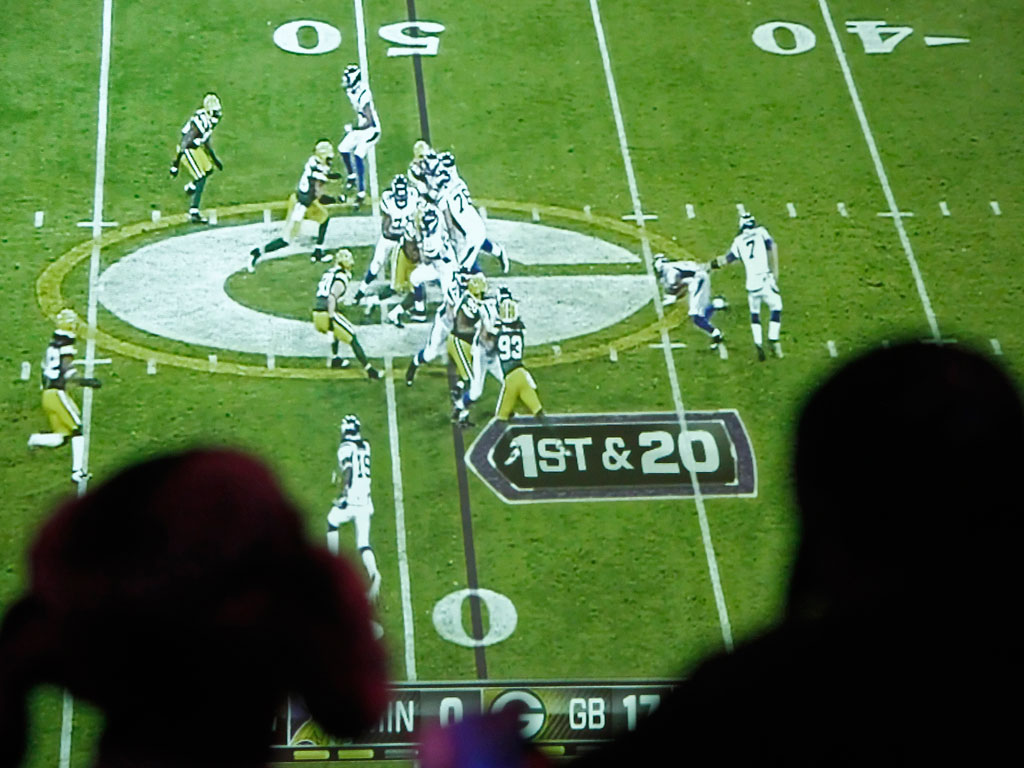
The 2011 Super Bowl match-up in Arlington, Texas, drew the largest TV viewing audience — 111 million — in U.S. history, surpassing the previous record (the 2010 Super Bowl) by 4.5 million.
But as millions of Americans settled in front of their TVs, UT Knoxville professor Yilu Liu focused, instead, on her computer screen. While the Green Bay Packers and Pittsburgh Steelers vied for the Super Bowl title in Cowboys Stadium, Liu charted the gains and losses occurring not on the field but along the millions of miles of wire that make up the U.S. power grid.
Liu is the UT-Oak Ridge National Laboratory Governor’s Chair for power systems in the College of Engineering. Her goal is to create a smarter electric grid that automatically resolves minor disruptions before they escalate to major blackouts. Liu leads the Power Information Technology (IT) Laboratory at UT Knoxville, and it operates the frequency monitoring network (FNET) with sensors in place across the nation.
During the Super Bowl, FNET continuously monitored changes in the frequency of the power flowing through the grid and automatically dispatched alerts on the grid’s health and functioning to Liu’s computer. The alerts also went out to the organizations responsible for monitoring and maintaining the flow of electricity through the U.S. power system.
 Just before kickoff at 6:29 p.m. Eastern time, millions of Americans engaged in a pre-game ritual — sliding snacks into pre-heated ovens, opening refrigerator doors to extract cold beverages, microwaving popcorn and flushing toilets. (Yes, even flushing toilets uses electricity. When toilets flush, utilities activate electrical pumps to maintain pressure in the lines.)
Their collective actions triggered a huge surge in power consumption that rippled through the grid, as electricity producers adjusted generating levels on the fly to keep up with changes in demand. Their goal: to keep the power flowing through the lines at a near constant 60 hertz. And they succeeded, largely because they knew what was coming.
Not so less than a week earlier, when temperatures in southeast Texas plunged into the 20s — extreme for the region. The combination of cold and a dramatic increase in electricity demand, as shivering Texans turned on their electric heaters, pushed beyond the grid’s operating margins and triggered the shutdown of 50 power plants and a loss of 7,000 megawatts of generating capacity.
The Electric Reliability Council of Texas responded with rolling blackouts that temporarily deprived more than a million homes of power but averted a complete collapse of the system.
Liu and her colleagues are determined to relegate such events to the past. She believes part of the answer may lie in a powerful but low-cost technology housed in a small beige box called a Frequency Disturbance Recorder (FDR).
Liu’s FDR is to the nation’s power grid what an electrocardiogram is to a hospital patient. While the EKG measures the electrical activity of the human heart, FDRs networked via the Internet are able to register the electrical pulse moving through the wires that connect power stations to end-users’ toasters, air conditioners and TVs. Liu developed the FDR with funding from the National Science Foundation and the Tennessee Valley Authority.
Currently, UT’s FNET tracks 80 FDRs placed around the country. The number will ultimately grow to 2,000. At this number, it will provide high-density coverage of the U.S. grid.
The Beat of a Healthy Hertz
“Everyone was looking at a relatively small piece of the larger puzzle.” The U.S. power grid carries alternating current at a frequency of 60 hertz, or 60 cycles per second. FDRs are capable of measuring subtle fluctuations and imbalances in supply by sampling the power flowing from a standard 110-volt wall outlet. The FDRs compute the frequency, voltage and phase angle (collectively known as phasor) 1,440 times per second. The unit’s GPS receiver provides a timing signal — precise to the microsecond — as the unit’s algorithm detects and records the fluctuations.
All information is sent in real time via the Internet to FNET servers at Lui’s Power IT Laboratory, where all data are archived.
Minor disruptions, though detectable by the FDRs, are of little consequence. Not so with major disturbances, like the one that resulted in the blackout of Aug. 14, 2003, when the normal 60-hertz frequency dropped as low as 52 hertz in some regions of the nation. The incident began in northeastern Ohio, where a chance encounter between a sagging, overloaded power line and a tree triggered a cascading power outage that, within a few minutes, had shut down more than 20 power stations and affected 50 million people in Canada and seven U.S. states. For some, the blackout lasted 30 hours.
FNET went online in 2004. Had it been fully operational a year earlier, it could have provided power-system operators with the real-time information necessary to help avert the worst blackout in U.S. history, or at least to limit its scope and duration.
“With the tools available in 2003, system operators could not recognize the severity of the situation until hours later,” says Liu. “There was no global picture of the entire system. Everyone was looking at a relatively small piece of the larger puzzle.”
View to a (Power) Kill
FNET enables dramatic visualization of such disturbances on a map, with the contented green of a system in stasis suddenly flashing in waves of red, orange, blue and purple, representing wildly fluctuating frequencies. The waves emanate outward from the source of the disturbance.
For example, when nuclear reactors unexpectedly tripped offline in Florida in 2008 — resulting in a statewide power outage — FNET’s sophisticated triangulation algorithms processed its units’ GPS-timed signals to instantly locate the source of the disturbance and sent out automatic alerts to power providers.
If the event threatened a major power disruption, these organizations could then take action to avoid system collapse and prevent damage to equipment by strategically shutting down individual loads and power-generating facilities (rolling blackouts) or reducing the voltage supplying the system (brownouts).
“We may not be able to predict that a certain power line will touch a tree” or when millions of Texans will turn on their heaters, says Liu, “but we can detect disturbances that can cause major disruptions, like an EKG detects heart attacks.”
Get Smart
“When major disruptions occur, there is no time for human response,” says Liu.Liu’s work represents a critical component of what will evolve into the sensors and nerves of a smart grid, and she credits the wealth of shared resources at UT and ORNL with major advances in her research, as well as the support from the Electric Power Research Institute and some 20-plus major electric power utilities and manufacturers.
A five-year, $18 million award from the National Science Foundation and the U.S. Department of Energy will lead to creation of the nation’s first Engineering Research Center (ERC) devoted to power transmission systems. Liu and Kevin Tomsovic, head of UT Knoxville’s Electrical Engineering and Computer Science Department and ERC director, will lead the new center, called CURENT (Center for Ultra-wide-area Resilient Electric Energy Transmission Networks), which will involve a consortium of academia, industry and national laboratories, including TVA and Oak Ridge National Laboratory.
Liu’s next project will rely on UT’s Kraken and ORNL’s Jaguar supercomputers to model power grid operations based on measurement data provided by the FDRs and other sensors. The computer operations will simulate, much more quickly than real time, the potential ripple effects of disruptions to the power supply.
Eventually, data such as those created by FNET will feed into a self-healing system of intelligent algorithms capable of triggering automatic remedial action.
“When major disruptions occur, there is no time for human response,” says Liu.
Power outages are troublesome and expensive. According to a 2004 study by Lawrence Berkeley National Laboratory, outages cost the United States about $80 billion a year.
Liu makes it clear that even a smart grid will be susceptible to occasional disruptions, but she and her colleagues are determined to reduce their frequency and spread — something that will benefit us all.
“We’re all connected to the system,” she says. That’s not necessarily a good thing, if a toppled tree in Ohio can turn out the lights in New York City.
Someday, as Liu’s research pays off, predicting the outcome of the Super Bowl will remain the province of the odds-makers, but the reliability of the wires bringing the game into millions of American homes will be a sure bet.
For more information, to go: fnetpublic.utk.edu and powerit.utk.edu.